
If you run an accounting firm, a consulting practice, a law firm, or any other B2B service business, there is a good chance your website has Google Analytics installed, and an even better chance you almost never look at it.
When you do open it, you see a wall of numbers that don't obviously connect to anything you care about: sessions, bounce rate, pages per session, average engagement time. You watch traffic go up and feel vaguely good. You watch it go down and feel vaguely concerned. Neither reaction is based on what the data is actually telling you.
That is not a failure of attention. It is a failure of framing.
Most analytics guides are written for e-commerce businesses and SaaS companies — organizations that sell online, run paid advertising, and measure success in transactions. If you follow that advice, you will end up optimizing for metrics that have almost nothing to do with how your business actually grows.
A B2B service company is a fundamentally different kind of business. Your conversion is a phone call or a contact form submission. Your sales cycle is weeks, maybe even months, not minutes. Your best new client probably found you through a referral, and the second thing they did was look up your website to decide whether to trust the referral.
Your website needs to be measured differently. This guide covers the six metrics that actually tell you whether your website is working, what to stop measuring because it is misleading you, and how to turn all of it into a fifteen-minute monthly routine. At the end, there is a free Looker Studio dashboard template that does the data collection for you. Just connect your GA4 property, and it populates automatically.
The standard analytics playbook treats your website like a funnel: traffic enters at the top, conversions come out the bottom, and you optimize the steps in between. That model works when the entire buying process happens online; when someone can discover, evaluate, and purchase in a single session.
That is not how service businesses work.
When someone is considering hiring a CPA firm or a consulting practice, they are not making a decision in one visit. They read your about page to see if your team looks credible. They check your services page to confirm you handle what they need. They come back two days later to re-read something. They might visit three times over two weeks before they fill in a contact form, or they might read one page, decide you're the right fit, and call you directly.
That direct call shows up in your analytics as a twenty-second session with a very low engagement rate. By the standard playbook, that looks like a failure. It was actually your best possible outcome.
This is the core problem with applying generic analytics advice to a service business. The metrics that matter for an e-commerce site, like how long someone stayed, how many pages they viewed in one visit, and whether they left without clicking anything, are weak signals for a business where qualified buyers routinely research quietly and convert offline.
What you actually need to know is simpler: are the right people finding your website, are they reaching the pages that matter, and are they taking action when they get there? These six metrics answer those questions.
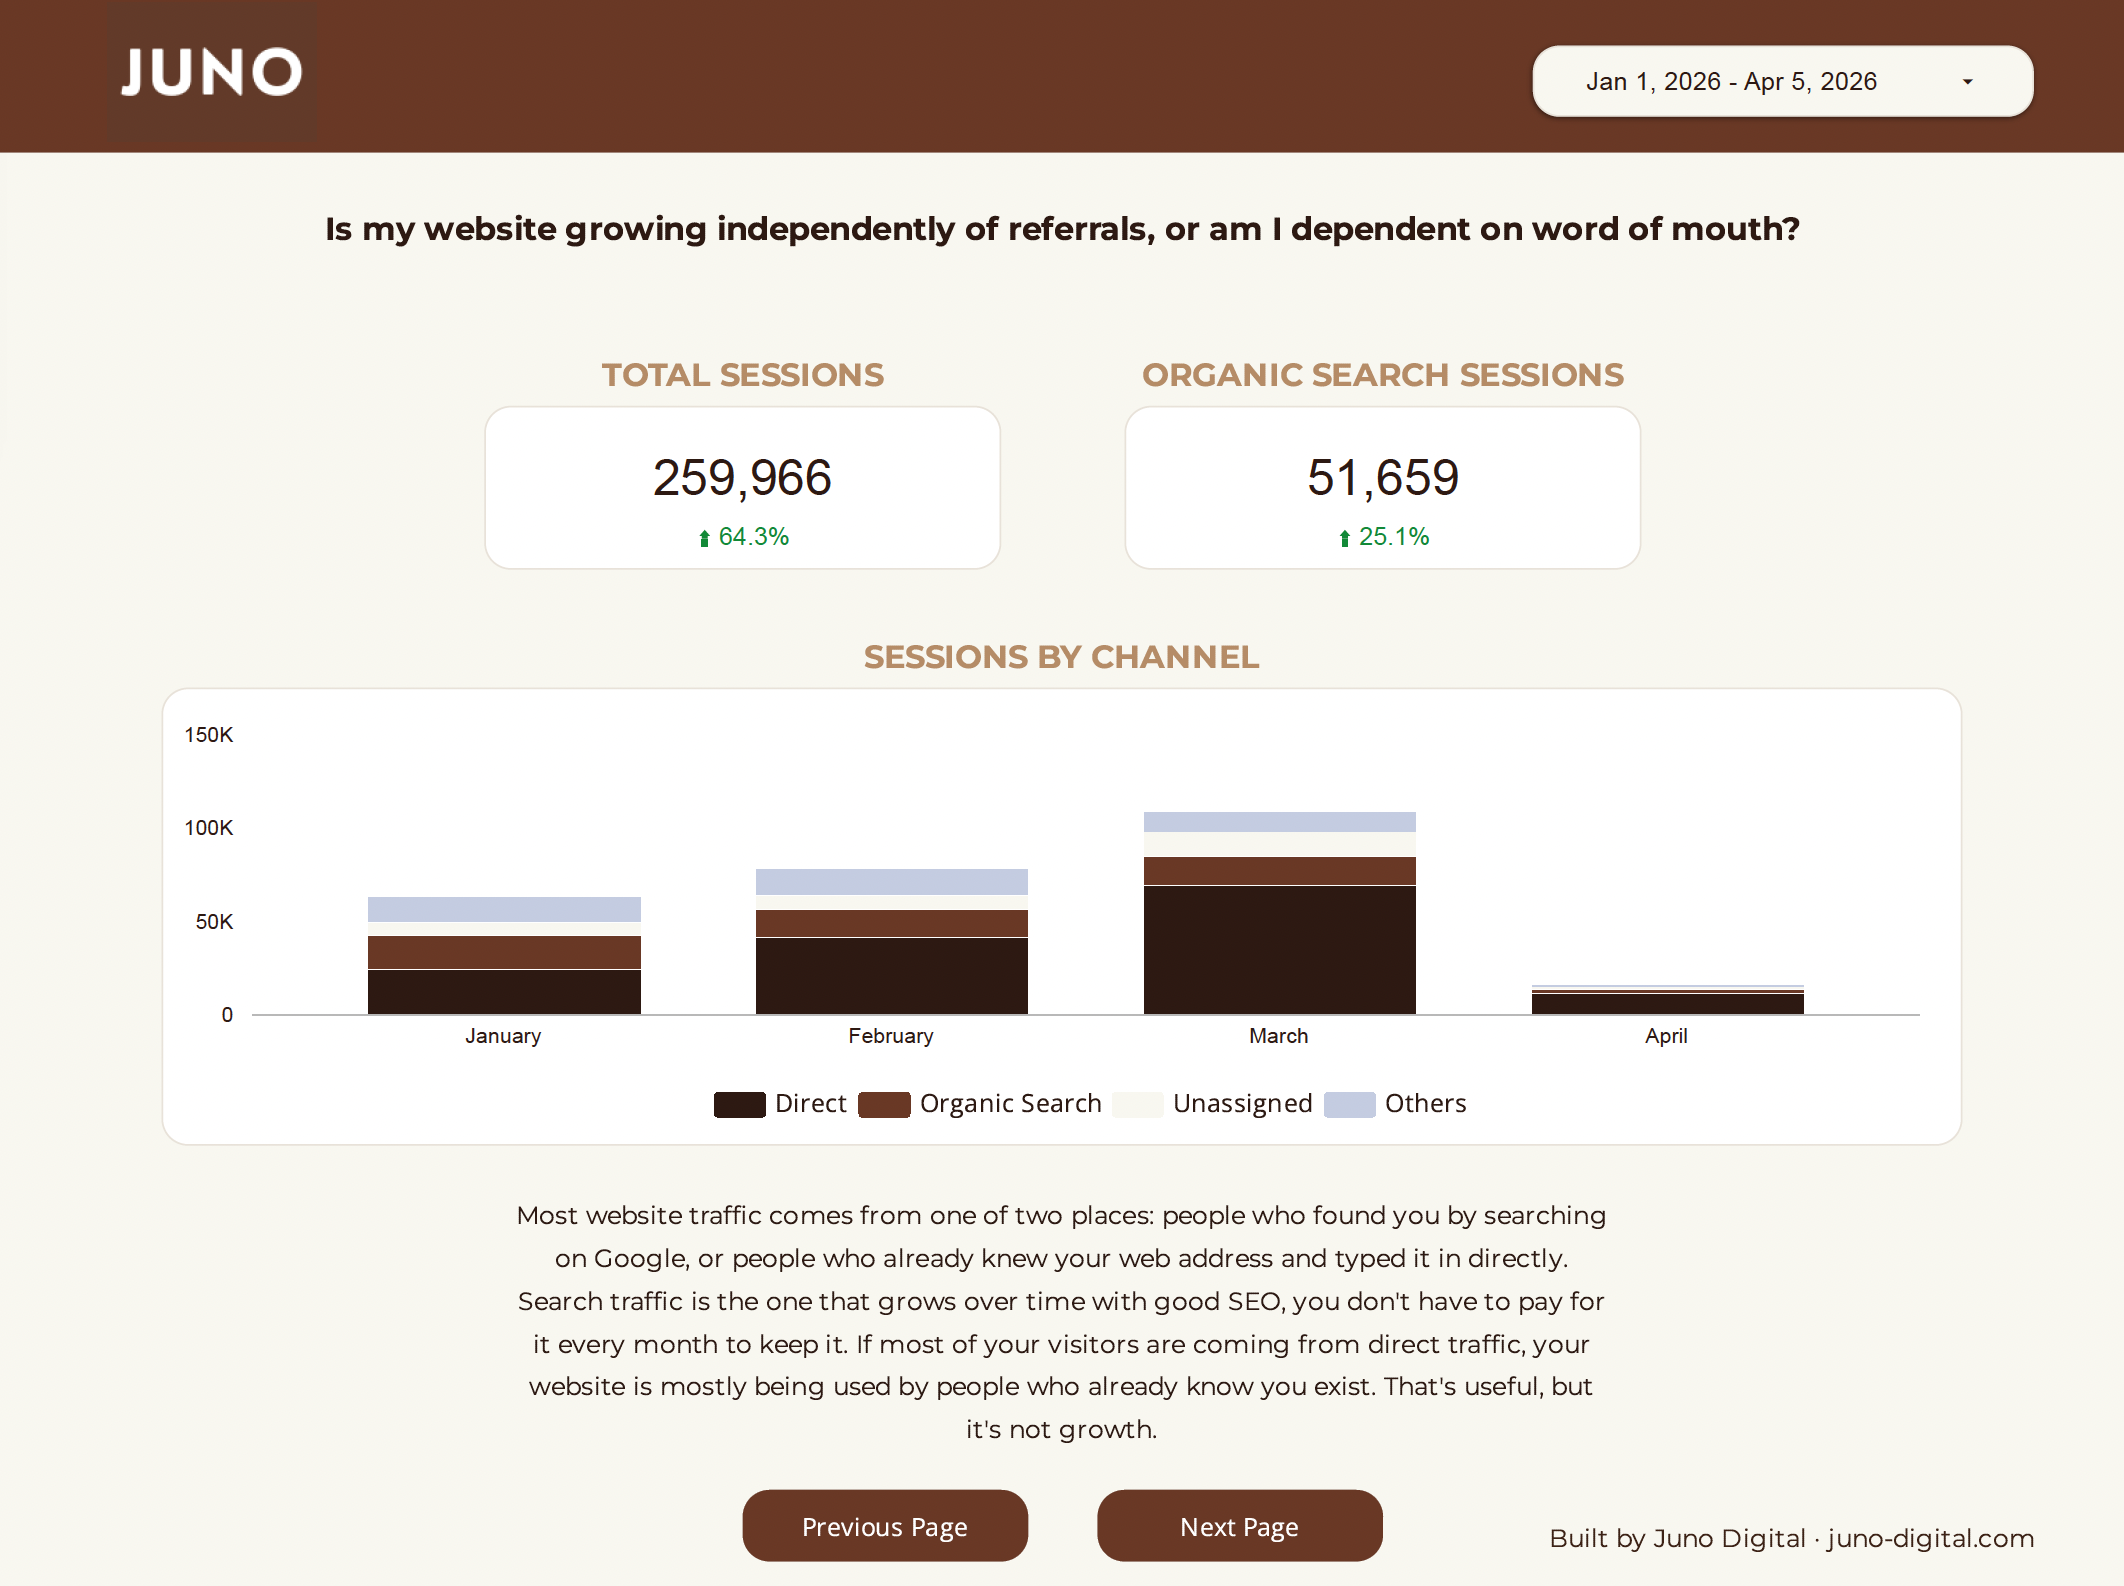
The question: Is my website growing independently of referrals, or am I completely dependent on word of mouth?
For most service firms, the answer right now is: mostly dependent on word of mouth. And that is fine as a starting point, but it is a ceiling.
Here's why this matters. When someone refers a client to you, that client already knows your name. They may visit your website, but the referral is doing the selling. Your website is just confirming the decision. That traffic shows up in your analytics as Direct, people who typed your URL or came from a saved bookmark.
Organic search is different. It is people who found you on Google without knowing your name first. Strangers who found your firm because they were searching for what you do. This is the channel that builds your client base beyond your existing network, and it is the only major channel that grows over time without ongoing advertising spend.
In GA4: Reports → Acquisition → Traffic acquisition. The channel breakdown shows you the split between Organic Search, Direct, Referral, and others.
Watch the organic search percentage over time, not just the raw number. For most service firms that haven't done much intentional work on their website yet, organic search makes up a small fraction of total sessions, often less than ten to twenty percent. That is a normal starting point, not a problem. But it is also the number with the most room to grow, and it grows as your website becomes more visible to people searching for what you do. If that percentage is flat or shrinking while direct traffic grows, your website is getting better at serving people who already know you, but not better at finding new ones.
The question: When people land on my site, are they staying long enough to get a real impression — or leaving immediately?
Before we get to the number, one important clarification: bounce rate is gone. GA4 replaced it with engagement rate in 2023, and the change matters. An engaged session is one that lasted at least ten seconds, viewed more than one page, or triggered a conversion event like a form submission. This is a much more honest measure of session quality than bounce rate was, because it correctly counts the qualified prospect who reads one page and calls you as an engaged visitor, not as a bounce.
Why does this matter for your business specifically? Because your website has a job to do in a short window. Someone who found you through a referral, or who searched for your services, has arrived with some level of intent. If they leave in three seconds, something went wrong; it could be that the page was slow to load, the content didn't match what they expected, or the site felt untrustworthy. Engagement rate tells you how often that is happening.
In GA4: Reports → Engagement → Overview. Engagement rate appears as a percentage.
For service businesses, fifty-five to seventy percent is a healthy range. Below fifty percent is worth investigating; look at which specific pages are driving low-engagement sessions, since a problem on one page can drag down your overall rate significantly.
The question: Are visitors actually getting to the pages where buying decisions happen?
Your homepage is the front door. It gets the most traffic by design, and that is fine. But a visitor who lands on your homepage and leaves without going further has not learned enough about your firm to make a decision about you. The pages where that decision happens — your services page, your about page, your contact page — are the ones worth tracking.
Think of it this way: if a hundred people visit your website this month and only two visit your contact page, ninety-eight of them left before they got to the action you most want them to take. That ratio tells you something meaningful, independent of whether your total traffic is up or down.
In GA4: Reports → Engagement → Pages and screens. Sort by views and look specifically at your high-intent pages: /contact, /services, /about, /team. Track these page views month over month rather than getting lost in the full list.
If these pages consistently have low views relative to total sessions, there are two likely explanations: visitors are not finding the navigation to get there, or they are arriving without enough interest to look further. Both are diagnosable. Both are fixable.
The question: Is my website actually generating leads, or just traffic?
This is the metric that is different in kind from all the others. Sessions, engagement rate, and page views are diagnostic; they tell you what visitors are doing on your site. Key events tell you whether any of it is turning into real business activity.
A key event is a tracked action that represents genuine intent: a contact form submission, a phone number click, a request for a consultation. These are the moments where a website visitor raises their hand and says they want to talk to you. Everything else on this list is context. This is the outcome.
In GA4: Reports → Engagement → Events. Key events are marked distinctly in your event list.
One important caveat: if you do not see form submissions or phone number clicks in your event list, your GA4 tracking is likely not configured to capture them. This is the single most important technical issue to fix before anything else, because without it you are essentially tracking everything except the thing that matters most. If you are not sure whether your key events are set up correctly, this is worth verifying before you draw any conclusions from your data.
Once your tracking is in place, key events become the first thing you check every month. If this number is growing, something is working. If it dropped significantly, something changed, and the other metrics help you understand what.
The question: Which pages are finding new clients, and which ones are invisible to search?
A landing page is the first page a visitor sees when they arrive at your site. Filtering your landing pages to show only organic search sessions tells you which pages are actually showing up in Google and sending traffic, not which pages are getting the most visits overall, but which ones are doing the work of discovery.
This distinction matters because for most service firms, organic traffic is heavily concentrated. The homepage might be the only organic landing page. That is a common starting point, but it has a hard ceiling: a homepage alone can only rank for so many searches, and most of those searches are branded, meaning people looking for your firm by name. The searches that bring in genuinely new prospects are the ones about your services, your location, and your specific expertise. Those searches require pages built around them.
In GA4: Reports → Engagement → Landing page. Add a filter for Session default channel group = Organic Search to show only organic sessions.
Look at how many unique pages are appearing in this list. For most service firms checking this for the first time, the answer is one or two, almost always the homepage and maybe one other page. That is where most firms start. The number grows as your website adds content that answers the specific questions your potential clients are searching for. The composition of the list tells you which parts of your site Google has found useful enough to show people, and which parts are essentially invisible to search right now.
The question: Is my website finding people who have never heard of my firm, or just serving people who already know me?
Returning visitors are a genuinely good sign. Someone who visits your site more than once is considering you seriously enough to come back; they are in a longer evaluation process, which is exactly what you would expect from the kind of client relationship you want to build. Do not be discouraged by a high returning visitor percentage.
What to watch is whether your new user count is growing over time. If the percentage of new users is flat or declining month over month, your website is not building awareness beyond your existing network. It might be serving the people who already know you well, but it is not finding new ones.
In GA4: Reports → Retention. Or search for "New / returning" as a dimension in any report.
For a growing service firm, new users should represent at least fifty percent of total users. This metric moves slowly: watch it quarterly rather than reacting to month-to-month noise. But tracking it monthly means you catch a declining trend before it becomes entrenched.
These metrics appear in almost every analytics guide. For service businesses, they are largely noise.
Average session duration. A thirty-second session that ends in a phone call is your best possible outcome. A six-minute session from someone who got lost on your site and left frustrated is not. Without knowing what happened after the session, duration tells you almost nothing. Use engagement rate instead.
Total pageviews. Pageviews measure activity, not quality or intent. A confused visitor clicking around trying to find your phone number inflates your pageview count just as much as an engaged prospect reading your case studies. Track specific pages — contact, services, about — not raw volume.
Bounce rate. This metric no longer exists in GA4. If you are still reading about bounce rate in your analytics documentation, that documentation is out of date. Engagement rate is the replacement and is a more useful measure for the reasons described above.
Social media referral traffic. Unless you are actively running a social media program, organic social referral traffic for a service firm is typically a handful of sessions per month, not a meaningful channel. Tracking it creates the appearance of a strategy where there is not one.
The first time you go through this process, you are not diagnosing anything. You are establishing a baseline. You will not know whether your engagement rate is improving until you have tracked it for a few months. You will not know whether organic search is growing until you have watched the channel mix over time. The value of this routine compounds; it gets more useful every month you do it.
Here is the order of operations:
Start with key events. How many form submissions or phone clicks happened this month compared to last month? If this number is growing, the rest of the check-in is context for what is working. If it dropped, the rest of the check-in helps you understand why.
Check your channel mix. Check your channel mix. Note what percentage of sessions is coming from organic search this month, and even if the number is small, write it down. This is your baseline. Future months will tell you whether it is moving. A sudden jump in direct traffic often signals a referral surge or a mention somewhere offline. A significant drop in any channel is worth noting, even if you don't act on it immediately.
Review engagement rate. Is it in the fifty-five to seventy percent range? Stable from last month? If it dropped significantly, which pages are dragging it down? The pages and screens report sorted by engagement rate will show you quickly.
Look at your high-intent pages. Are your services and contact pages getting meaningful traffic relative to total sessions? If contact page views dropped while total traffic was flat, that gap is worth investigating.
Check your top organic landing pages. Are the same pages pulling organic traffic as last month? Did any new pages start appearing? Consistent organic landing pages signal stable rankings. A page that disappears from the list lost traffic from somewhere.
Finish with new vs. returning users. Is your new user percentage stable? This moves slowly. Note it and move on unless you see a clear directional trend.
The whole process takes fifteen minutes when your data is already assembled. That's exactly why we built you a dashboard.
Going through this check-in manually in GA4 every month means rebuilding the same views and applying the same filters each time, which takes far longer than 15 minutes. We built a dashboard so you don't have to.
The template covers all six metrics described in this post. Each page asks one question, shows you the data, and includes a plain-language note explaining what you are looking at and what a healthy result looks like for a service business — not a generic benchmark built on e-commerce data.
Setup takes about two minutes. Click "Use Template," select your GA4 property from the dropdown, and the dashboard populates with your data. No GA4 expertise required.
Enter your email below to get the free dashboard template
If you've read this far and you're not entirely sure what your numbers mean, or you looked at your GA4 and the picture doesn't make sense, that is a normal place to be. Most service companies have analytics data they have never fully interpreted, and drawing the wrong conclusions from it can send you in the wrong direction for months.
If you have looked at your analytics and the picture isn't clear, or if you have never really looked at all and you are not sure where to start, that is a completely normal place to be for a firm that has been focused on doing the work rather than marketing it. It is also exactly the right moment to get a clearer picture of where your website stands. That is the kind of work we do.
Juno Digital is a boutique SEO and digital growth consultancy based in Austin, Texas.